
Back to the 2024 paper
Similar questions
Data MiningDraw decision tree for the following data sets. Use entropy as a node selection mechanism: | Outlook | Temp (F) | Humidity | Windy | Class | |:---|:---|:---|:---|:---| | Rainy | Hot | High | False | No | | Rainy | Hot | High | True | No | | Overcast | Hot | High | False | Yes | | Sunny | Mild | High | False | Yes | | Sunny | Cool | Normal | False | Yes | | Sunny | Cool | Normal | True | No | | Overcast | Cool | Normal | True | Yes | | Rainy | Mild | High | False | No | | Rainy | Cool | Normal | False | Yes | | Sunny | Mild | Normal | False | Yes | | Rainy | Mild | Normal | True | Yes | | Overcast | Mild | High | True | Yes | | Overcast | Hot | Normal | False | Yes | | Sunny | Mild | High | True | No |202014mMACHINE LEARNINGApply the ID3 algorithm on the following data to draw a decision tree. Show the Information Gain at each split. ### Dataset | Outlook | Temperature | Humidity | Windy | PlayTennis | |-----------|-------------|----------|-------|-------------| | Sunny | Hot | High | False | No | | Sunny | Hot | High | True | No | | Overcast | Hot | High | False | Yes | | Rainy | Mild | High | False | Yes | | Rainy | Cool | Normal | False | Yes | | Rainy | Cool | Normal | True | No | | Overcast | Cool | Normal | True | Yes | | Sunny | Mild | High | False | No | | Sunny | Cool | Normal | False | Yes | | Rainy | Mild | Normal | False | Yes | | Sunny | Mild | Normal | True | Yes | | Overcast | Mild | High | True | Yes | | Overcast | Hot | Normal | False | Yes | | Rainy | Mild | High | True | No |202510mMACHINE LEARNINGFor the Sun Burn data set given below, construct a decision tree. | Name | Hair | Height | Weight | Location | Class | |--------|--------|----------|---------|----------|-------| | Sunita | Blonde | Average | Light | No | Yes | | Anita | Blonde | Tall | Average | Yes | No | | Kavita | Brown | Short | Average | Yes | No | | Sushma | Blonde | Short | Average | No | Yes | | Xavier | Red | Average | Heavy | No | Yes | | Balaji | Brown | Tall | Heavy | No | No | | Ramesh | Brown | Average | Heavy | No | No | | Sweta | Blonde | Short | Light | Yes | No |202314mMACHINE LEARNINGFollowing is a data set that contains two attributes, X and Y, and two class labels, ‘+’ and ‘–’. Each attribute can take three different values: 0, 1, or 2. The concept for the ‘+’ class is Y = 1 and the concept for the ‘–’ class is X = 0 ∨ X = 2. 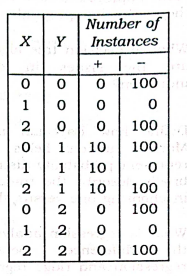 (a) Build a decision tree on the data set. Does the tree capture the ‘+’ and ‘–’ concepts? (b) What are the accuracy, precision, recall and F1-measure of the decision tree? (Note that precision, recall, and F1-measure are defined with respect to the ‘+’ class.)202214m
PreviousExplain resolution in First-Order Logic (FOL). Using a simple knowledge base (e.g., "All humans are mortal, Socrates is a human"), derive a conclusion using resolution refutation.NextHow can semi-supervised learning be useful in real-world scenarios like email spam detection? Describe its working with an example involving labeled and unlabeled data.
Budget AppAndroid App
Pocketly on Android
Log daily food, travel, and hostel expenses instantly. Set monthly spending limits and see where your money goes without complex spreadsheets.