
Back to the 2022 paper
Similar questions
Data MiningWhat is over-fitting and under-fitting of a model? When do they happen?20237mData MiningWhat is over-fitting and under-fitting of a model? When do they happen?20216mData MiningWhat do you mean by under-fitting and over-fitting of a classification model?20214mData MiningDiscuss overfitting and underfitting in decision tree construction with suitable example.20227m
PreviousFollowing is a data set that contains two attributes, X and Y, and two class labels, ‘+’ and ‘–’. Each attribute can take three different values: 0, 1, or 2. The concept for the ‘+’ class is Y = 1 and the concept for the ‘–’ class is X = 0 ∨ X = 2. 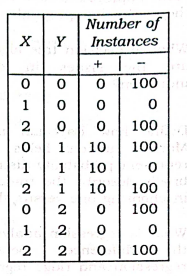 (a) Build a decision tree on the data set. Does the tree capture the ‘+’ and ‘–’ concepts? (b) What are the accuracy, precision, recall and F1-measure of the decision tree? (Note that precision, recall, and F1-measure are defined with respect to the ‘+’ class.)NextExplain the bagging and boosting with example.
Official AppAndroid App
PYQDeck for Android
Solve BEU previous-year exam papers anywhere, anytime. Fast search, offline paper viewing, and step-by-step solutions designed specifically for your phone.